TrendSpider Review for 2024
Some of the links on this page may link to our affiliates. Learn more about our affiliate policies.
Last Updated: January 5, 2023
TrendSpider Trading Software Review

Monthly Cost:
$39/month - $129/month
Cost If Paid Yearly:
- Premium: $33/month - $396/year
- Elite: $65/month - $780/year
- Advanced: $97/month - $1,164/year
Multiple Workspaces: 2-6
Alerts: 25-250
Max Results per Scan: 25-250
Alerts Expire In: 14 days - 90 days
Highlights:
- Realtime Futures Data Available Now (NEW)
- 7-day Free Trial
- No Hidden Charges
- 99.9% Uptime Guarantee
- 1-on-1 Training Included
- Phone, E-mail & Chat Support
Market Data Feeds:
- Real-time Data
- US Stocks & ETFs
- Currencies
- Digital Assets
- OTC/Pink-Sheet Stocks (delayed)
- Indices (delayed)
- Futures (delayed)
- After hours/pre-market
TrendSpider, a market-leading technical analysis and financial charting software for analysts, traders, and market technicians, is the leading platform for technical analysis and financial charts. TrendSpider was launched in March 2018. It has since attracted more than 4,000 active traders who use its fully automated, real-time market data daily to make informed trading decisions. TrendSpider data includes U.S. Equities, Foreign Currency Pairs, and Cryptocurrencies. They also have their proprietary Raindrop Charts and Auto-Anchored indicator.
TrendSpider's specialized software for analysis takes charting and alerts to a new level. You can also find innovative features like raindrop charts and popular analysis tools like Fibonacci Retracements. Is it more suitable for day traders or investors? Are the indicators and data of this charting platform best suited for retail traders?
This TrendSpider review will discuss the pros and cons of TrendSpider and provide a complete review from A to Z. TrenSpider will give you access to special offers such as a 15% TrendSpider coupon or a free trial. But, first, let's find out if T.S. can be considered one of the most effective stock screeners.
Here is a quick overview on some TrendSpider trading software company info:
- Founded: 2016
- Number of members: 5000+
- Check the company address at 2028 E. Ben White Blvd. #240-2010 Austin Texas 78741
- Try it out: 7 days for all three subscription plans
- TrendSpider Trading Blog and TrendSpider YouTube Channel offer free resources. TrendSpider Twitter account offers free resources
TrendSpider Review
TrendSpider, a market-leading technical analysis and financial charting software for analysts, traders, and market technicians, is the leading platform for technical analysis and financial charts. TrendSpider was launched in March 2018. It has since attracted more than 4,000 active traders who use its fully automated, real-time market data daily to make informed trading decisions. TrendSpider data includes U.S. Equities, Foreign Currency Pairs, and Cryptocurrencies. They also have their proprietary Raindrop Charts and Auto-Anchored indicator.
TrendSpider's specialized software for analysis takes charting and alerts to a new level. You can also find innovative features like raindrop charts and popular analysis tools like Fibonacci Retracements. Is it more suitable for day traders or investors? Are the indicators and data of this charting platform best suited for retail traders?
This TrendSpider review will discuss the pros and cons of TrendSpider and provide a complete review from A to Z. TrenSpider will give you access to special offers such as a 15% TrendSpider coupon or a free trial. But, first, let's find out if T.S. can be considered one of the most effective stock screeners.
Transparency: Some of the links in our articles are affiliate links. If you click on these links, we may be compensated. However, affiliation does not affect how we review and rate the products.
TrendSpider Plans, Costs, and Pricing
TrendSpider is one of the best analysis tools, and it recently changed its entire pricing structure. There was previously a distinction between the markets that you subscribed to. The pricing options have been simplified and now come with a clear pricing structure.
There are two options for subscriptions: monthly or annual. Monthly subscriptions start at $44 for Premium, Elite, $87/month, and Advanced, $131/month. You save 16% when you subscribe on an annual basis. For over 30% savings, use the coupon code DTDZ15 to reduce your prices.
Annual subscriptions with coupon DTDZ15
- Premium: $374
- Elite and Executive members pay $740 annually
- $1,114 annually for Advanced
| Premium | Elite | Advanced | |
|---|---|---|---|
| Monthly Pay | $39/month | $79/month | $129/month |
| If Paid Yearly | $33/month or $396/year | $65/month or $780/year | $97/month or $1,164/year |
| Smallest Timeframe | 1 Minute | 1 Minute | 1 Minute |
| Multiple Workspaces | 2 | 4 | 6 |
| Alerts | 25 | 100 | 250 |
| Alerts Expire In | 14 Days | 30 days | 90 Days |
| Min Scanner Timeframe | 1 Day and Up | 1 Minute and up | 1 Minute and up |
| Max Results Per Scan | 25 | 100 | 250 |
| Monthly Backtests | N/A | Unlimited | Unlimited |
| Training | 1 Session | Unlimited | Unlimited |
| Phone Support | None | Yes | Yes |
| Priority Service | None | Yes | Yes |
TrendSpider Software Now Offers Realtime Futures Data
On September 14th, 2022 TrendSpider announced that it has partnered up with CME and are bringing their customers the majority of the US futures data for CME, CBOT, NYMEX and COMEX listed futures contracts. CME provides a comprehensive list of the most commonly used futures symbols, including NQ, RTY, and CL. Click to see a complete list of all futures contracts.
Futures Data Costs
Non-pro subscribers cost for futures data will be $7.50/mo. However, if your current plan includes a coupon code, Futures data's price will be adjusted based on the discount. For example, futures data will be $3.50/mo if you currently receive 50% off your plan. The discount will be valid for the entire duration. After you have agreed to the exchange agreement and entered your personal information, you will be asked to subscribe to the feed. You will be charged monthly for the data.
Futures on the Platform
All TrendSpider tools, such as the Strategy Tester and Market Scanner, Trading Bots and Multi Symbol View Workspace, and Alerts, can be used with Futures data. You can also access new Futures watchlists via your sidebar in the same way as any other watchlist. All the available watchlists are accessible by simply typing 'Futures" into the search bar at the top of the widget. These lists can be used in the market scanner to locate all futures symbols that meet your scan criteria. The video below will explain how to access futures data agreements and sign up for data access.
Test Trendspider for Free - 7-day Free Trial
TrendSpider offers a seven-day trial. You can try TrendSpider free of charge for seven days. We don't know how long. The subscription can be canceled at any time during your seven-day trial.
To evaluate the validity of the product under market conditions, you can access the complete version. Moreover, you can do this with very little out-of-pocket costs. TrendSpider offers smart trading tools at an affordable price.
- After seven days, you'll be charged for your subscription.
Use the trial period to try TrendSpider. The trial periods are a sign of trust and authenticity. Ensure you have as much time as possible to test each feature, data source, trading system, and other features during the trial period.
TrendSpider's multi-factor analysis, machine learning, and candlestick pattern recognition make TrendSpider easy to use for analysis. However, you will need a brokerage trading platform to trade.
Once you get started, the learning curve is steep. However, once you have used the charting software, it is simple to use the trendlines and automated charting.
TrendSpider Features
TrendSpider, a stock analysis software and an automated technical analysis program, is designed to help you day trade, swing trade, and invest. It is designed to assist you in identifying and exploiting trends quicker than an average trader and track price movements and indicators.
- Trendspider was established in 2016 and is a fully customizable and innovative trading platform. Smart algorithms take emotion out of the trading equation.
- Traders created TrendSpider for traders. It serves thousands of members.
- They have offices in Chicago, Denver, and India.
- The core components include automated technical analysis, trendlines, charts, indicators, and dynamic price alerts. Trading education is available via video and in-depth blog posts.
Great Data Visualization Charts
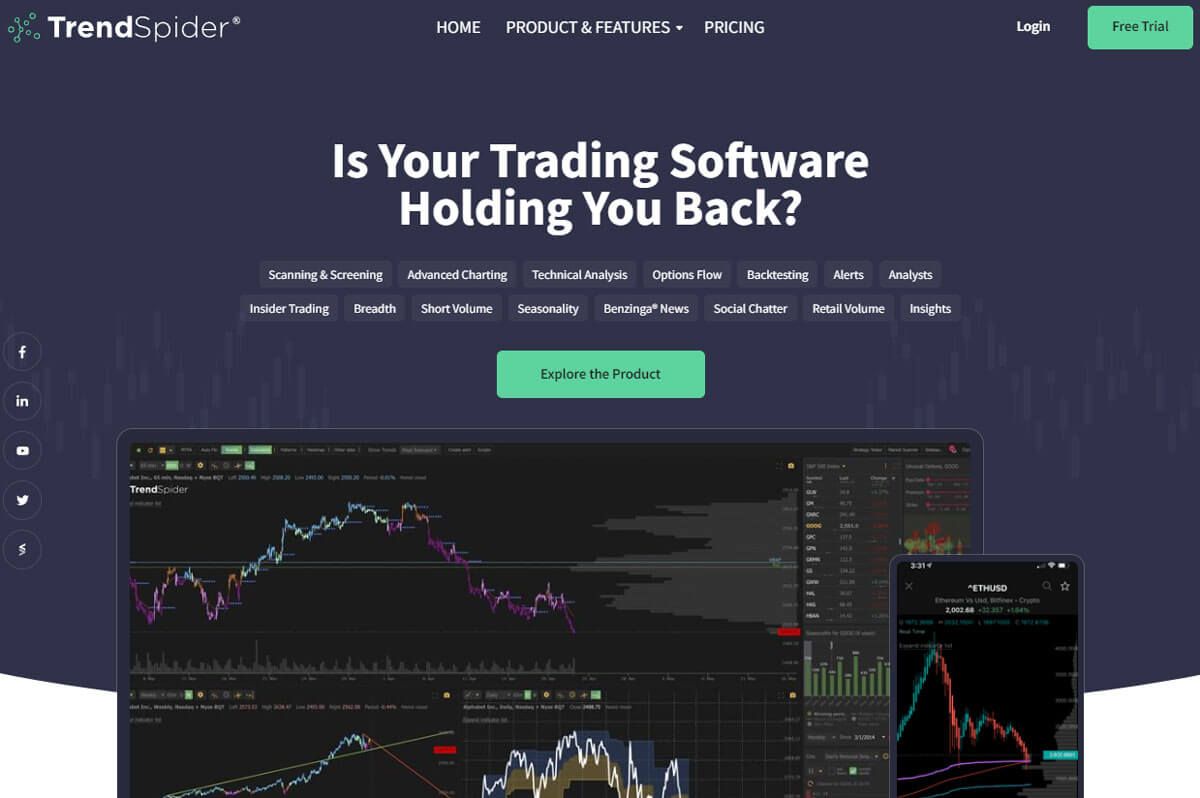
Many platforms allow for technical analysis and basic research. However, We often use TrendSpider to visualize technical aspects. We keep coming back to it over and over again. TrendSpider charts look amazing and can be used for so many purposes.
You can find a variety of charts: line charts, bar charts, and candlestick charts. Other types of charts that you can find are the Raindrop and Heikin Ashi charts. The platform also offers hundreds of trading indicators, pattern detection, a heatmap, Fibonacci tools, and ABCD patterns; performance graphs, earnings estimations, unusual options visualization, and many more.
Let's move on to the additional features that TrendSpider offers:
- Automatic Candlestick Pattern Recognition: The chart automatically displays candlestick patterns and provides all the necessary technical indicators. You can draw support and resistance lines and create automated Fibonacci retracements. Prices for U.S. stocks, ETFs, forex, and cryptos are updated in real-time. The subscription package includes delayed data indices as well as EOD futures data.
- Automated trendline detection: Finding the right anchors to create trendlines is often tedious. If you enable the option, TrendSpider will automatically draw trendlines. TrendSpider automatically draws trendlines with greater precision than hand drawing, making it more efficient and accurate.
- Automatic Fibonacci retracements: Investors and traders love Leonardo Fibonacci numbers. A pullback can reach the 50% level before the trend continues. This happens quite often. The TrendSpider algorithms automatically plot retracement lines, which is another time-saver.
- Automatic Dynamic Prices Alerts The Trend Spider algorithm uses stock data sets and facts to make decisions. You can now use quantifiable price levels rather than second-guessing or seeing your bias on the chart. This is true even for dynamic price alerts. Once your alert is triggered, you can define events such as price levels, technical indicators values, or multi-conditional alert variables. You get notified by email and SMS.
- Multi-Timeframe Analysis: Expert skills are required to trade the multi-timeframe if each time frame is separately analyzed. TrendSpider makes it easier to work with higher indicator values on lower time frames and vice versa.
TrendSpider's tools allow traders to automate their Technical Analysis with the charting platform. It makes it easy to do stock research and analysis.
- Draws trendlines
- Trendline analysis supports
- Recognize candlestick patterns
- Calculates and draws automatic Fibonacci Retracements.
- With mathematical precision, it detects and highlights more than 40 candlestick shapes.
What's the benefit? This software automates technical analysis and can remove emotion and bias from trading. Dojis will always be Dojis. A breakout will always be a breakout. But, what's the most important? Speed.
Traders know that speed is key to making money in the market. One second delay can differentiate between a profitable opportunity and a missed opportunity.
Raindrop Charts
TrendSpider is making great progress in developing innovative trading tools. Their Raindrop Chart, a new type of financial chart that removes arbitrary constructs such as close and open prices and focuses instead on market sentiment, is one of the most innovative features they have created.
Raindrop charts do not convey price changes but incorporate volume to validate price movements and provide deeper insight. As a result, it is a compelling alternative to traditional candlestick charts, focusing only on price and requiring additional overlays to analyze volume.
Each bar in a Raindrop Chart is known as a raindrop and covers a set period. It includes the high, low, and left and right means. The left means are the mean price-weighted based on volume for the first half, while the right means are the mean price-weighted based on volume for the second half.
TrendSpider also supports U.S. stocks and forex. This is amazing, and it also includes unique features such as:
- Instant back testing functionality
- Recognition of chart patterns
- Trendline analysis
- Analysis of multiple timeframes
- All charts can use Alphatrends' VWAP.
Raindrop charts, a new type of visualization that TrendSpider developed for traders as an alternate to the traditional candlestick pattern, offer a completely new perspective when viewing a chart.
It can also be used to analyze time frames. This makes it an excellent alternative to traditional charts such as candlestick charts and bar charts with Bollinger Bands. In addition, trend Spider no longer only considers standard Open, High and Low prices. Instead, it also considers price development and the VWAP.
You can now see the volume profile and the price trend over time (red candle, green candle, Doji). What's the pro? The pro? The candlestick tells a good story. It is a strong, green candle that closes near the top.
Raindrops are a visual representation of the same story, but they also provide information about the period's volume profile. The period ended with heavy volume. This is a bullish sign that triggers signals differently than candlesticks.
Heatmap
The heatmap provides detailed information. The program colors code historical and current order book support levels and resistance levels. This is an additional advantage over other tools.
TrendSpider automates Trendline Analysis
TrendSpider calculates the strength of long-term and shorter-term trends. The chart displays automatic trendlines. Many settings can be used. It is simple to use, and dynamic alerts are also possible.
Multi-Time Frame Analysis
This is quite cool. You can overlay it with a multi-timeframe analysis
- Trendlines
- Values of indicator values
- Candlestick patterns from other periods.
Analyze the Basic Chart
Are you a fan of a particular candlestick pattern? Do you want to plot trend lines automatically? Are you looking to do a basic technical analysis of price charts? This web-based software makes it possible to do all this. But, first, look at the Trend Spider review, including the customization and backtesting options.
TrendSpider Options Flow
TrendSpider's brand new Options Flow feature was released in early 2022. In addition, TrendSpider officially added the real-time Options Flow scanner to the platform. The community strongly requested this. As a result, TrendSpider now makes it possible to track unusual options flows.
It can track large directional options trades such as block trades or options sweeps. For example, this could indicate an institutional investor placing a huge directional bet. You can easily visualize the results in a widget, including the trade size, expiration dates, strike price, and expiration date.
- The unusual options scatterplot charts unusually visualize options trading behavior. It makes it easy to spot unusual trades. This chart is a great way to track unique options and follow big money.
TrendSpider Review: Strategy Backtesting
TrendSpider's backtesting tool is a great way to do backtests. Backtesting can be done in various timeframes, from one minute to daily and monthly charts. In addition, you can do this with confidence in many financial assets and markets.
It only covers the basics. NinjaTrader offers more advanced backtests. NinjaTrader requires you to code in C#. Trade-Ideas allow you to backtest your trading strategies quickly without programming knowledge. Trade Ideas' backtest engine works on tick data and is much faster than other tools we have used.
- TrendSpider is even more fun because it includes a backtesting tool. All packages include it. The TrendsSpider Standard package only includes ten tests per calendar month. This feature will be tested more in the coming weeks. I'll update the TrendSpider review accordingly.
Other TrendSpider Features
- Automated charting features provide enterprise-grade reliability and speed
- Fully customizable analysis rules that you can tailor to your trading style
- You can keep track of smart and customized watchlists to ensure you don't miss any trading opportunities
- Different graphics and visual templates are available for customizing interface themes
- Sync dynamic alerts via email or SMS notifications
- Charts and alters that can be customized to your exact specifications
- Multi-time frame features
- Technical analysis using trend lines, support, resistance, and technical patterns
- You can have quiet hours without worrying about price alerts
Charting platforms also offer sensitivity control for indicator and trendline alerts using specific data sets and filters. When moving averages cross or other technical analysis-based things are triggered, an alert can be sent to you.
You can choose how close you want an asset price to be to a particular indicator before getting a price alert. This is a useful tool as trendlines generally don't always appear the same way. Visual patterns may look similar but aren't always the same as the pattern you want to identify.
TrendSpider Recognized as 2021 Benzinga Global Fintech Awards Winner

Benzinga, a firm that helps investors reach the next stage in their growth and promotes innovation across all sectors, hosts the Benzinga Global Fintech Awards. This award recognizes and rewards disruptive innovators who make positive and diverse improvements to the financial services industry. A select few Benzinga Fintech listmakers were ranked based on their investing, technology, and financial literacy contributions. The Zingy Award and People's Choice Award were given to the listmakers who received the highest judging scores.
TrendSpider is a pioneer in fintech, having recently developed a highly customizable, state-of-the-art automated analysis software that allows users to quickly and efficiently analyze and chart securities. TrendSpider was founded in 2016 to make analysis more consistent. The company also provides tools to help investors make better trading decisions and reduce profit-killing errors.
The TrendSpider Advantage
TrendSpider, a charting and technical analysis software, is a powerful tool that allows you to trade with success. It includes customizable charts, alerts, and charts. It's primarily designed for stock analysis based on technical analysis and various scan methods.
TrendSpider can be accessed from anywhere. A disadvantage of a web-based platform over software solutions is its slow speed.
Trade ideas are my favorite stock screener. Trade-Ideas scans the market and can find every setup or pattern we want. You can choose between a locally installed or web-based version of Trade Ideas. Trade-Ideas offers integrated paper trading accounts. Trades are possible without taking any risk.
- The app is quicker and can save a day trader milliseconds by sending out scanner alerts. TrendSpider may be a great choice for swing traders, but Trade Ideas is still the best for day trading. Without a thorough analysis of the costs, what review would be complete without one? The subscription section of TrendSpider's review will show that the prices are reasonable for the value you get.
TrendSpider's Best for Who?
TrendSpider is the best software for traders who need real-time data and alerts in a modern trading platform. It is easy to use with automated charting and technical indicators such as exponential averages. In addition, it is easy to use dynamic price alerts.
You can automate the program or let it take all your decisions. You can customize the settings to give you full control, while TrendSpider enhances your skills in the background. TrendSpider can also be used traditionally.
- Charting software that allows you to insert your trendlines and indicators. However, fully automated stock trading requires a trader who is always available when an alert is received. Black box strategies should not be traded. Automated trendlines, Fibonacci Retracements and Candlestick Identification can help you save time. TrendSpider also has positive reviews, which can be found on their website.
Pros
- Price charts featuring over 40 candlestick patterns
- Dynamic price action alerts,
- Automatic price gap detection
- Advanced Fibonacci retracements detection,
- Keep an eye out for watch lists
- Technical indicators such as moving averages.
Cons
- Horizontal trendlines weren't supported. TrendSpider now takes the correct path. Selecting it from the sidebar or Alt+H to draw the trendline is possible.
The Community and Alternatives
This software tool lets you quickly analyze your favorite stocks and ETFs using just a few mouse clicks. Users will love their innovative analysis tool. In addition, you will find the community like that at Black Box Stocks very active and appreciate customer support.
- TrendSpider is a more advanced charting software solution than other options. Investors and traders can expect a fast backtesting engine, new charting functions, multi-timeframe analysis, candlestick patterns, and automated alerts.
TrendSpider Review Summary
TrendSpider, a chart platform and analysis software with reliable features is highly recommended. In addition, high-quality features such as automated trendlines and market intelligence are available at an affordable price.
This is great news for traders and the trading tools market. Investors and traders will benefit from a more competitive landscape. The integration of machine learning and market intelligence-based algorithms is not as deep as the market-leading stock screener Trade-Ideas.
- They do not currently use unfiltered tick-by-tick data from NYSE and Nasdaq. However, this is good for investors who want to use the stock market analysis platform. In addition, day traders will consider Trade Ideas that integrate trade automation.
- See more of The Best Funded Trader Programs for 2022
Risk Disclosure: This content is provided for informational purposes only. We strive to make the content accurate and current by updating it often. Sometimes, the actual data may differ from what is stated on our website. onlineproptrading.com operates independently. Although we are an independent platform, advertisements and sponsored products may compensate us. We also receive compensation for clicking on links on our website. Authors and contributors are not certified or registered financial advisors. Before making any financial decisions, you should consult a financial professional.